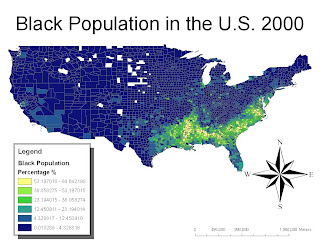
This map shows where the highest concentration of African Americans is in the U.S., and it's clear that the highest percentages occupy the Southern, Southeastern, and Eastern portions of the map. The highest percentages (between 53 and 85 percent) are located throughout Louisiana, Mississippi, and Alabama. I believe that in the 2010 Census, due in large part to Hurricane Katrina in 2005, the percentages will not be as concentrated in the South as they are now. I believe that a 2010 Census map will reflect blacks' inability to return to the South, based on certain socioeconomic factors brought upon by the hurricane; a 2010 map might show more even dispersion of the African American population in the Southern and Eastern portions of the map, and perhaps, more African Americans will appear in the middle part of the country.

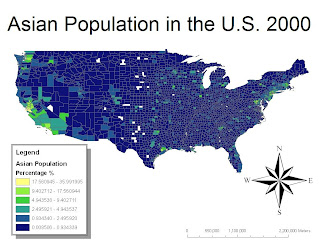
This map shows that the highest percentages of Asians, between 18 and 36 percent and between 9 and 17 percent, appear autocorrelated, or clustered, in certain spots along the map. These clusters are most predominate in Washington, in California's Bay Area (San Francisco), along the East Coast, and in a small portion of Texas. These clusters appear where the country is also most densely populated overall. I believe that a 2010 map of the Asian population in the U.S. will show a higher percentage of Asians in these concentrated Asians, because this is what I have read about 2010 census predictions.

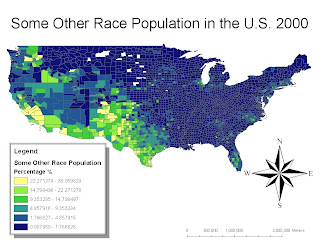
This last map shows the "Some Other Race Population" in the U.S., and this category was created for people who felt that they were unable to identify with the races listed in previous census studies. This category allows people to identify themselves as Moroccan, South African, Belizean, or a Hispanic(for example, Mexican, Puerto Rican, or Cuban). It's apparent that this group is highly concentrated throughout Texas and Southern California, and I believe this is due in large part to the influx of immigrants into the U.S. from Mexico (and elsewhere) who find low-wage jobs in the Southwestern and Western portions of the Country. Again, I believe that a map of the 2010 Census would reflect a more concentrated population of the Some Other Race Category, but this population won't shift too far from where it is now (in terms of location).

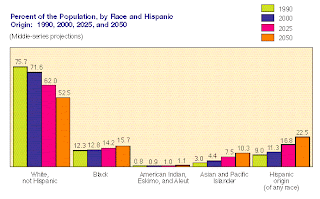
In order to reassert my predictions about the 2010 Census, I visited the U.S. Census Bureau website and found this chart. It predicts the population growth of various races from 1990 to 2050. This chart shows that the percentage of whites will steadily decrease, while the black, Asian, and Hispanic groups will increase. The greatest population growth might be seen in the Hispanic group, and the U.S. Census Bureau bases this prediction on a number of socioeconomic factors which include, but are not limited to: fertility/birthrate, quality and availability of health care, and immigration.
At first, I thought that this class was going to be solely based on maps and geographic locations of various places, but we have gone beyond that. We learned how maps can help policy makers make decisions and how maps can aid doctors and scientists in slowing or predicting where disease will occur. The most interesting thing that I learned from this course and from GIS is that anyone can make a meaningful map that can ultimately serve a higher purpose; maps can help better our understanding of the world in which we live.
